Frequency response is one of the primary specs that audio companies advertise on their product sales pages. More specifically the frequency response range, frequency response variance, and frequency response graph. Oh boy to the headphone people love their graphs.
But what is frequency response really? How important are these related specs actually? And how does this all ultimately influence how good something sounds? These questions will lay the groundwork to the discussion herein, including my opinion on all this after doing well over 100 audio reviews at this point.
What is Frequency Response in Audio?
Mathematically, frequency is just the number of iterations a periodic function goes through per unit of time. In other words, how many waves pass per second.
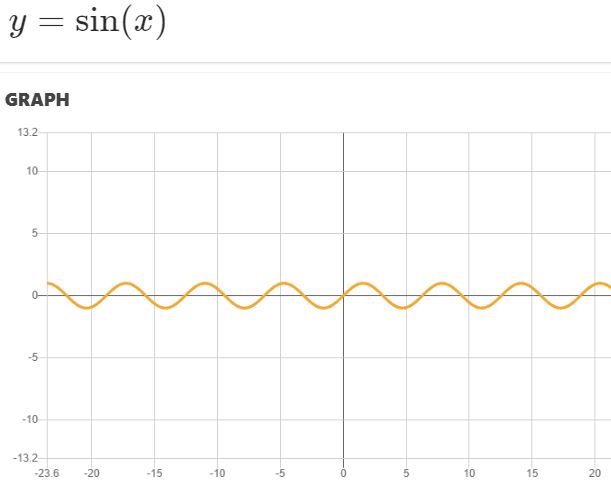
Frequency describes anything in the real world that follows a periodic pattern. For example: the pendulum of a clock swinging back and forth, the earth orbiting the sun, a bicycle wheel moving forward, and sound in fact, which is just waves of compressed air that emanate outward from a source.
The standard unit of frequency is hertz (Hz). One hertz means one cycle per second. So if a sound wave has a frequency of, say 2000 Hz, that means 2000 air waves hit your eardrum per second, and thus your eardrum moves back and forth (also periodically) 2000 times per second.
Pitch, or how low or high a note sounds, is how we perceive the frequency of sound. Low pitch sounds have lower frequencies, and higher pitch sounds will have very fast frequencies.
So what does the word “response” actually mean in frequency response then? We can look at the audio signal chain to understand that.
The electric signal that comes out of the amplifier is actually periodic too by design, and it causes a magnet inside the speaker to move back and forth in a corresponding fashion, and that magnet is connected to a driver (a woofer, tweeter, etc.), which moves back and forth to compress and expand the air around it and create sound waves.
The components of the speaker are simply responding to the electrical signal that’s coming in, and the theoretical idea is that the sound waves a speaker creates are an exact mathematical replica of the electrical signal it received. This would mean the speaker has perfect frequency response, and can thus perfectly reproduce the sound as it was originally recorded.
Theoretically perfect response is not realistically possible, as you can probably infer, but a rough design goal with audio products in general is to try and get close.
Frequency Response Range Spec Explained
Frequency response range is a common spec that you often see on an audio sales page. It simply means the total range of pitch, from low to high, that a speaker or headphone can physically create. A very common response range spec for budget headphones, for example, is 20 – 20k Hz, which also happens to be about the average response range of a human eardrum, in other words the range of pitch we can actually hear.
Frequency Response Consistency – The Variance Spec Explained
Frequency response variance is another advertised spec you’ll sometimes see. It simply means the consistency of volume a speaker or headphone creates across the entire range of frequency. This is relatively import because if a driver can only produce, say, mid-range sound at 50% of the volume of the rest of it, the song will sound terribly off, even if that driver is technically responsive at that level.
Frequency response variance is expressed as a differential or delta in decibels (dB). A +/- of 3 dB is a commonly agreed upon benchmark of consistent sound quality, meaning all sounds a speaker or headphone produces have a volume within 6 dB of each other.
How to Measure the Frequency Response of Headphones
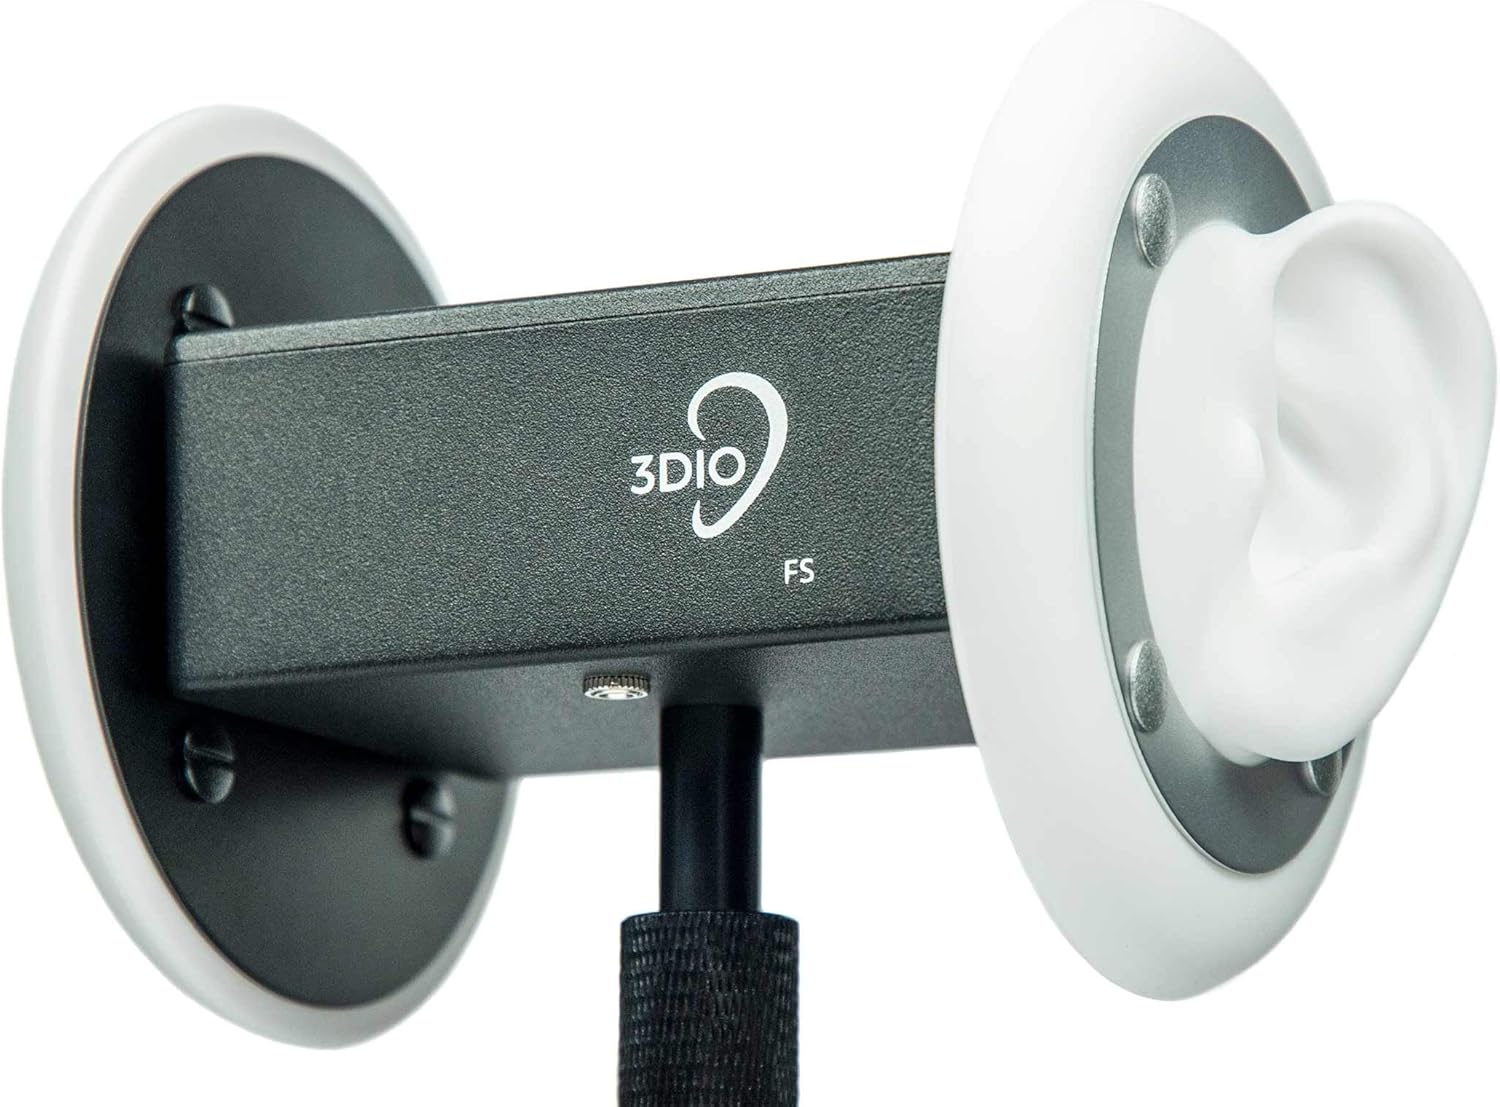
Frequency response is measured by placing a microphone at a fixed distance in front of a speaker. Or, to measure a headphone or earbud, with a mic inside an apparatus that mimics a human ear. Some of these measuring rigs cost tens of thousands of dollars, but more and more accessibly priced measuring products are starting to hit the market.
Putting it Together – The Headphone Frequency Response Graph
A frequency response graph is a two axis plot of volume (dB) as a function frequency (Hz) used to visually represent frequency response and is – ostensibly – a primarily important objective metric of sound quality. More on that later.
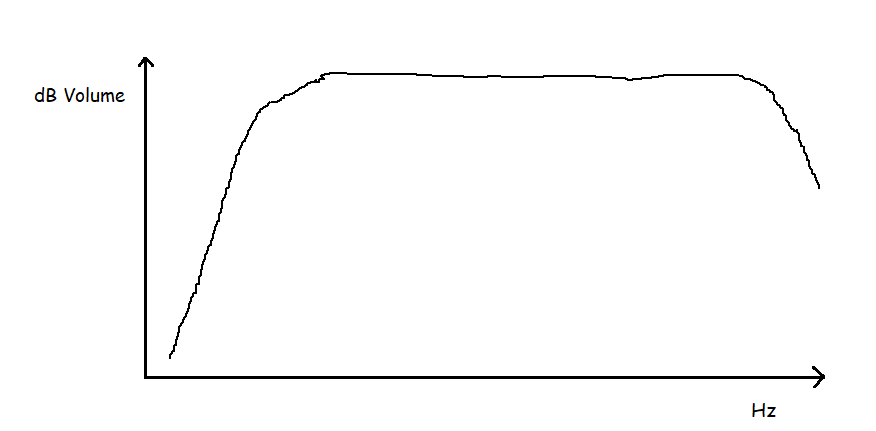
A theoretically perfect even/neutral response graph would just be flat across the range, perhaps with smooth roll off right along the ends of human hearing, and might be advertised as something like this:
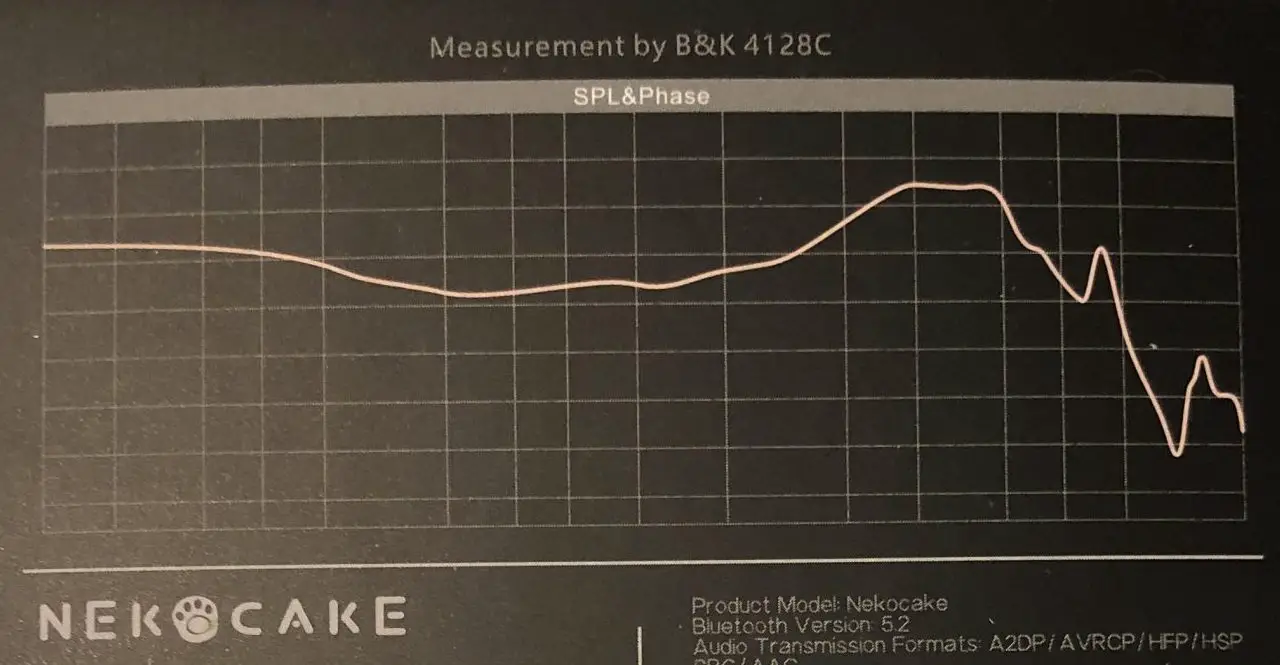
One again, perfect response and thus a perfectly flat graph is not realistically possible, and an actual advertised measurement will look something like this:
Subjective Variation, Tuning, and Styling
So does a perfectly flat and even speaker or headphone response imply it makes the best possible sound? No, and in fact, headphone manufacturers in particular will often target different curve shapes. One such popular target with budget and mainstream headphones is a U shape called the Harman Curve:
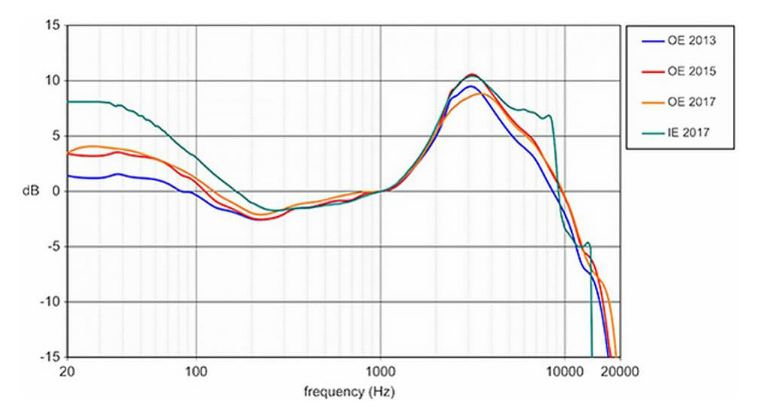
Harman International is an industry leader in audio research and technology, and the above are their “ideal” frequency response curve targets over the years, based on their testing and research on users’ preferences. So why does it look like that? and why do many companies target that? There’s a lot of reasons, but to name a few:
- Casual listeners, which is vast the majority of customers, like base
- A lot of modern music and recording puts an emphasis on bass and sounds better with tuned up low frequencies
- Emphasized bass coupled with mid/high range peak does a good job of making the sound feel full and immersive, giving the illusion of a wide sound stage.
When you’re limited to cramming hardware in an earbud case with a cubic centimeter of space for example, and you’re on a budget, it’s a good idea to take advantage of any “tricks” that you can.
Beyond the popular Harman curve, there’s all kinds of curve EQ styling that might sound better to one person, or with certain types of music. An audio engineer who’s critically listening to a track usually wants that neutral curve so they can objectively work on it as it actually is, even if it’s less aesthetic. Someone listening to, say, Jazz might want an ascending crisp and bright curve so they can really hear and appreciate each instrument, even it it sounds a little thin and harsh. And someone in the club might want a purely bassy curve because they just want to feel the beat and dance, and they don’t care about the intricate mids in an EDM track, if it even has any to begin with.
Jack of All Trades, But Master of None?
The fundamental determiner of how well a speaker driver can reproduce a given frequency is its physical size – larger woofers have an easier time producing bass sound waves because they are longer, and vice versa. That’s why subwoofer drivers usually have a 10+ inch diameter while tweeters have a diameter that’s an inch or less. Same thing goes for headphones and earbuds, just on a smaller scale.
This is but one problem with using the frequency response range spec as a metric of sound quality – companies might advertise a very wide response range or a low response floor, and maybe their tech truly does achieve either, but if you ask a static sized driver to reproduce a wider and wider range, it will do a less decent job at reproducing each specific sound. Hence the jack of all trades but master of none.
Speakers have an easier albeit more expensive way of overcoming this problem because you can just make them bigger and add more drivers and crossovers. Or the end user could add a separate subwoofer or even a tweeter.
But you can’t really do that so easily with headphones, much less earbuds. Most budget earbuds, for example, use a single dynamic driver because that might be all that can fit inside, or because that’s the only schematic that’s possible to manufacture profitably. There are multi-driver headphones and earbuds even, but, cramming more drivers into a case can introduce new problems as well, such as resonance or fit and comfort issues as a bud case has to inevitably get larger to accommodate them.
Yet More Confounders
There are so many more things that can distort a frequency response spec to the point that it’s practically meaningless. To name a few:
- The human ear is not equally sensitive to all frequencies within the audible range. The sensitivity of the human ear varies across different frequencies, with the highest sensitivity occurring around 2-5 kHz. Even if an audio device could produce a visually “perfect” looking measurement, we wouldn’t necessarily hear it in that way.
- Each single measurement will vary and is unavoidably somewhat random.
- A measurement taken with different equipment, with a different setup, in a different environment can yield a significantly different result.
- Companies and secondary publications rarely fully disclose their methods for obtaining the measurements they advertise or report. We don’t ever even know if they’re being truthful to begin with, or, if they’re maybe kinda sorta fudging it a little bit.
- The plastic measuring ear won’t ever have the same dimensions and acoustics as your ear.
Do Frequency Response Specs Actually Correlate With Sound Quality?
This is the crux of the discussion I think, and also the most opinionated. So I will talk about this based off my personal experience.
I have reviewed or otherwise listened to probably hundreds of different headphones and earbuds. I honestly haven’t noticed any correlation between how good something sounds and the purported wideness or consistency of its frequency response.
I also haven’t noticed any strong correlation between bass extension and purported frequency response floor. I’ve listened to so called basshead headphones with low response floors where the actual sound of the bass doesn’t reflect that at all, and noticeably recesses and rolls off. I’ve also listened to budget earbuds with dead average response range specs where the bass sounds great and the drops I normally test fully come through.
Conclusion
The point here isn’t to imply that frequency response measurements are pointless and that no one should bother doing them. They can be useful and interesting, and I look at them often.
The point moreso is that audiophiles tend to not see the forest because they’re looking at the trees. What I mean is, we don’t buy equipment to produce nice looking measurement graphs to look at – we buy it to listen to it, and frequency response is by no means an objective end all be all for determining sound quality, which is something that’s ultimately subjective and situational.